Live Demo: See GEC in Action
Watch how the GEC platform works — from inventory monitoring and sales analytics to AI insights and content optimization.
Everything You See in the Dashboard
Each section of the live report is designed to give you complete visibility into your e-commerce performance. Here's what every part of the dashboard does.
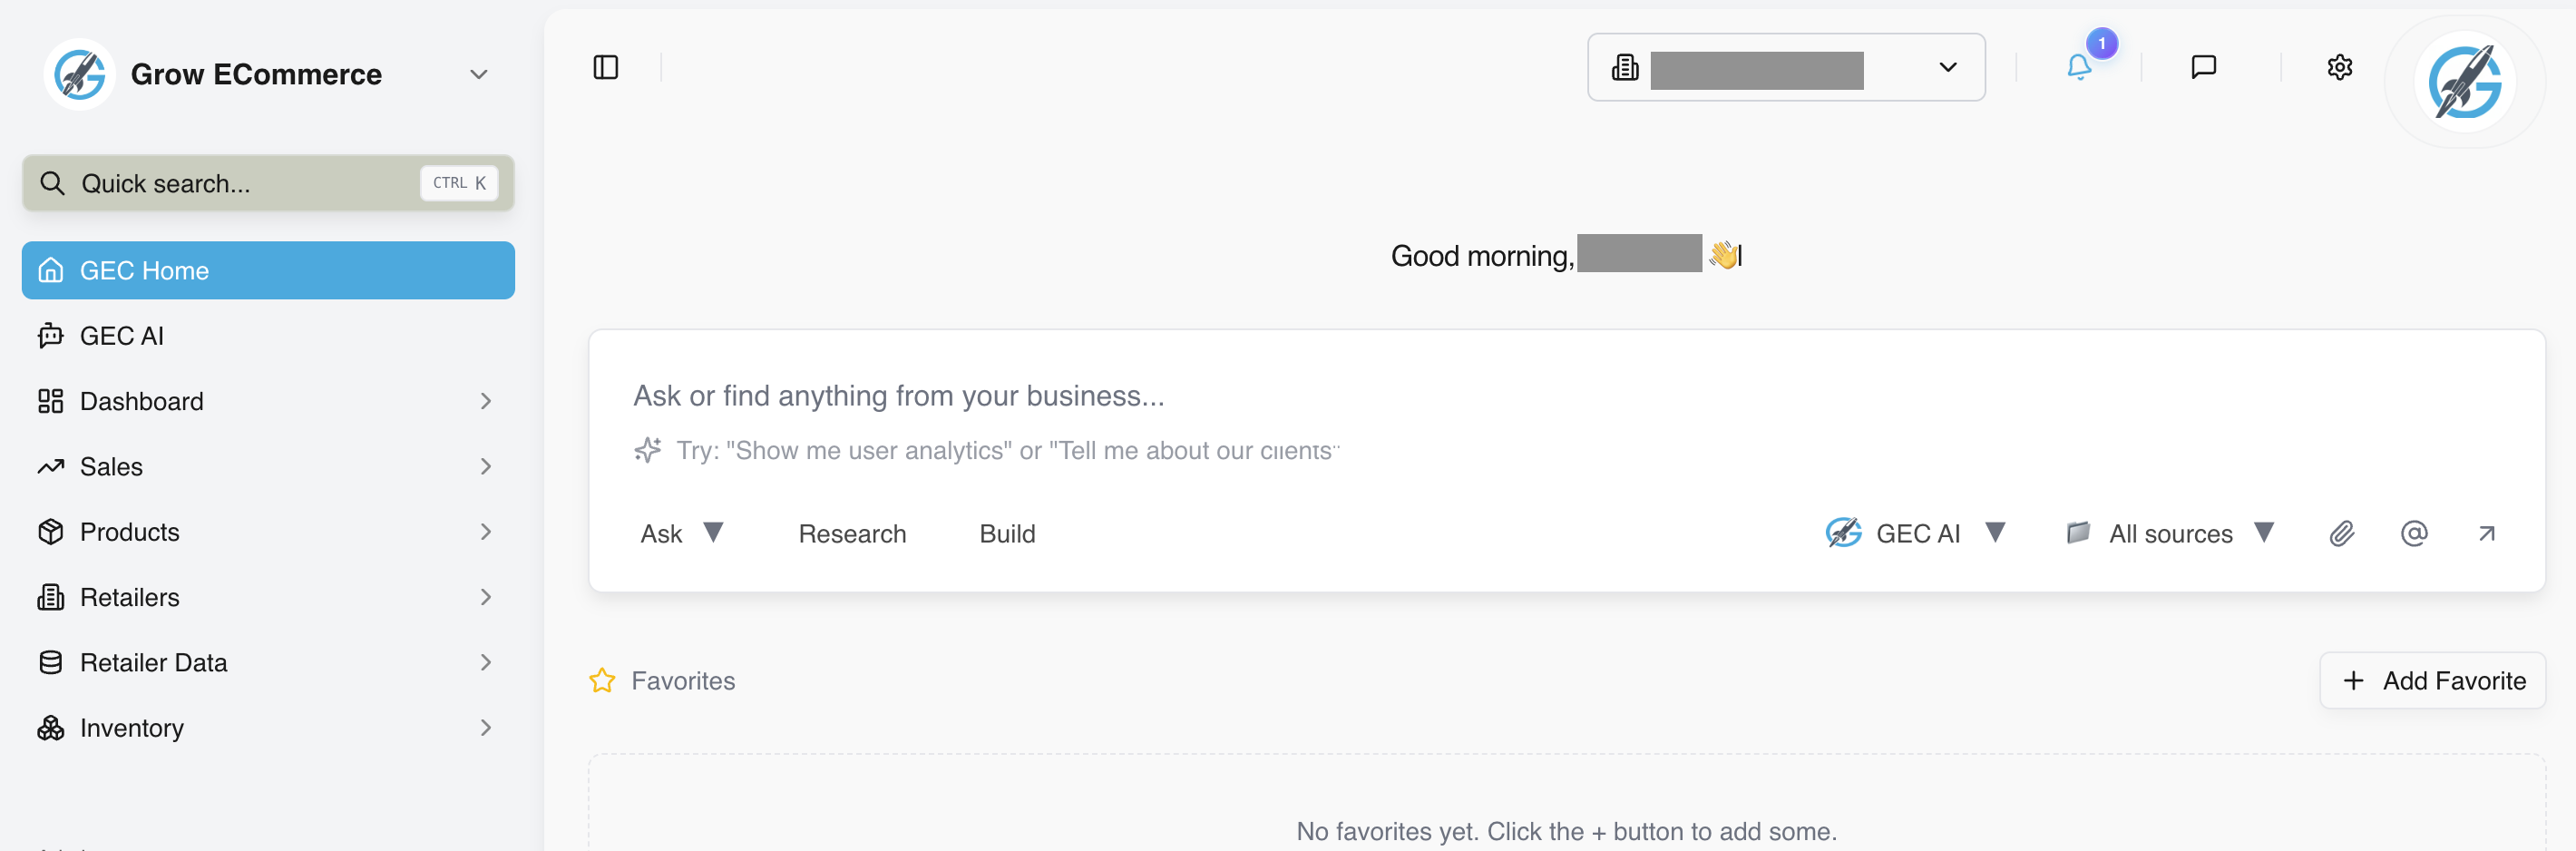
GEC Home
A bird’s eye view of all your selling channels and performance at a glance. From sales trends and catalog health to inventory levels and AI-driven insights — everything you need to grow, centralized in one place.
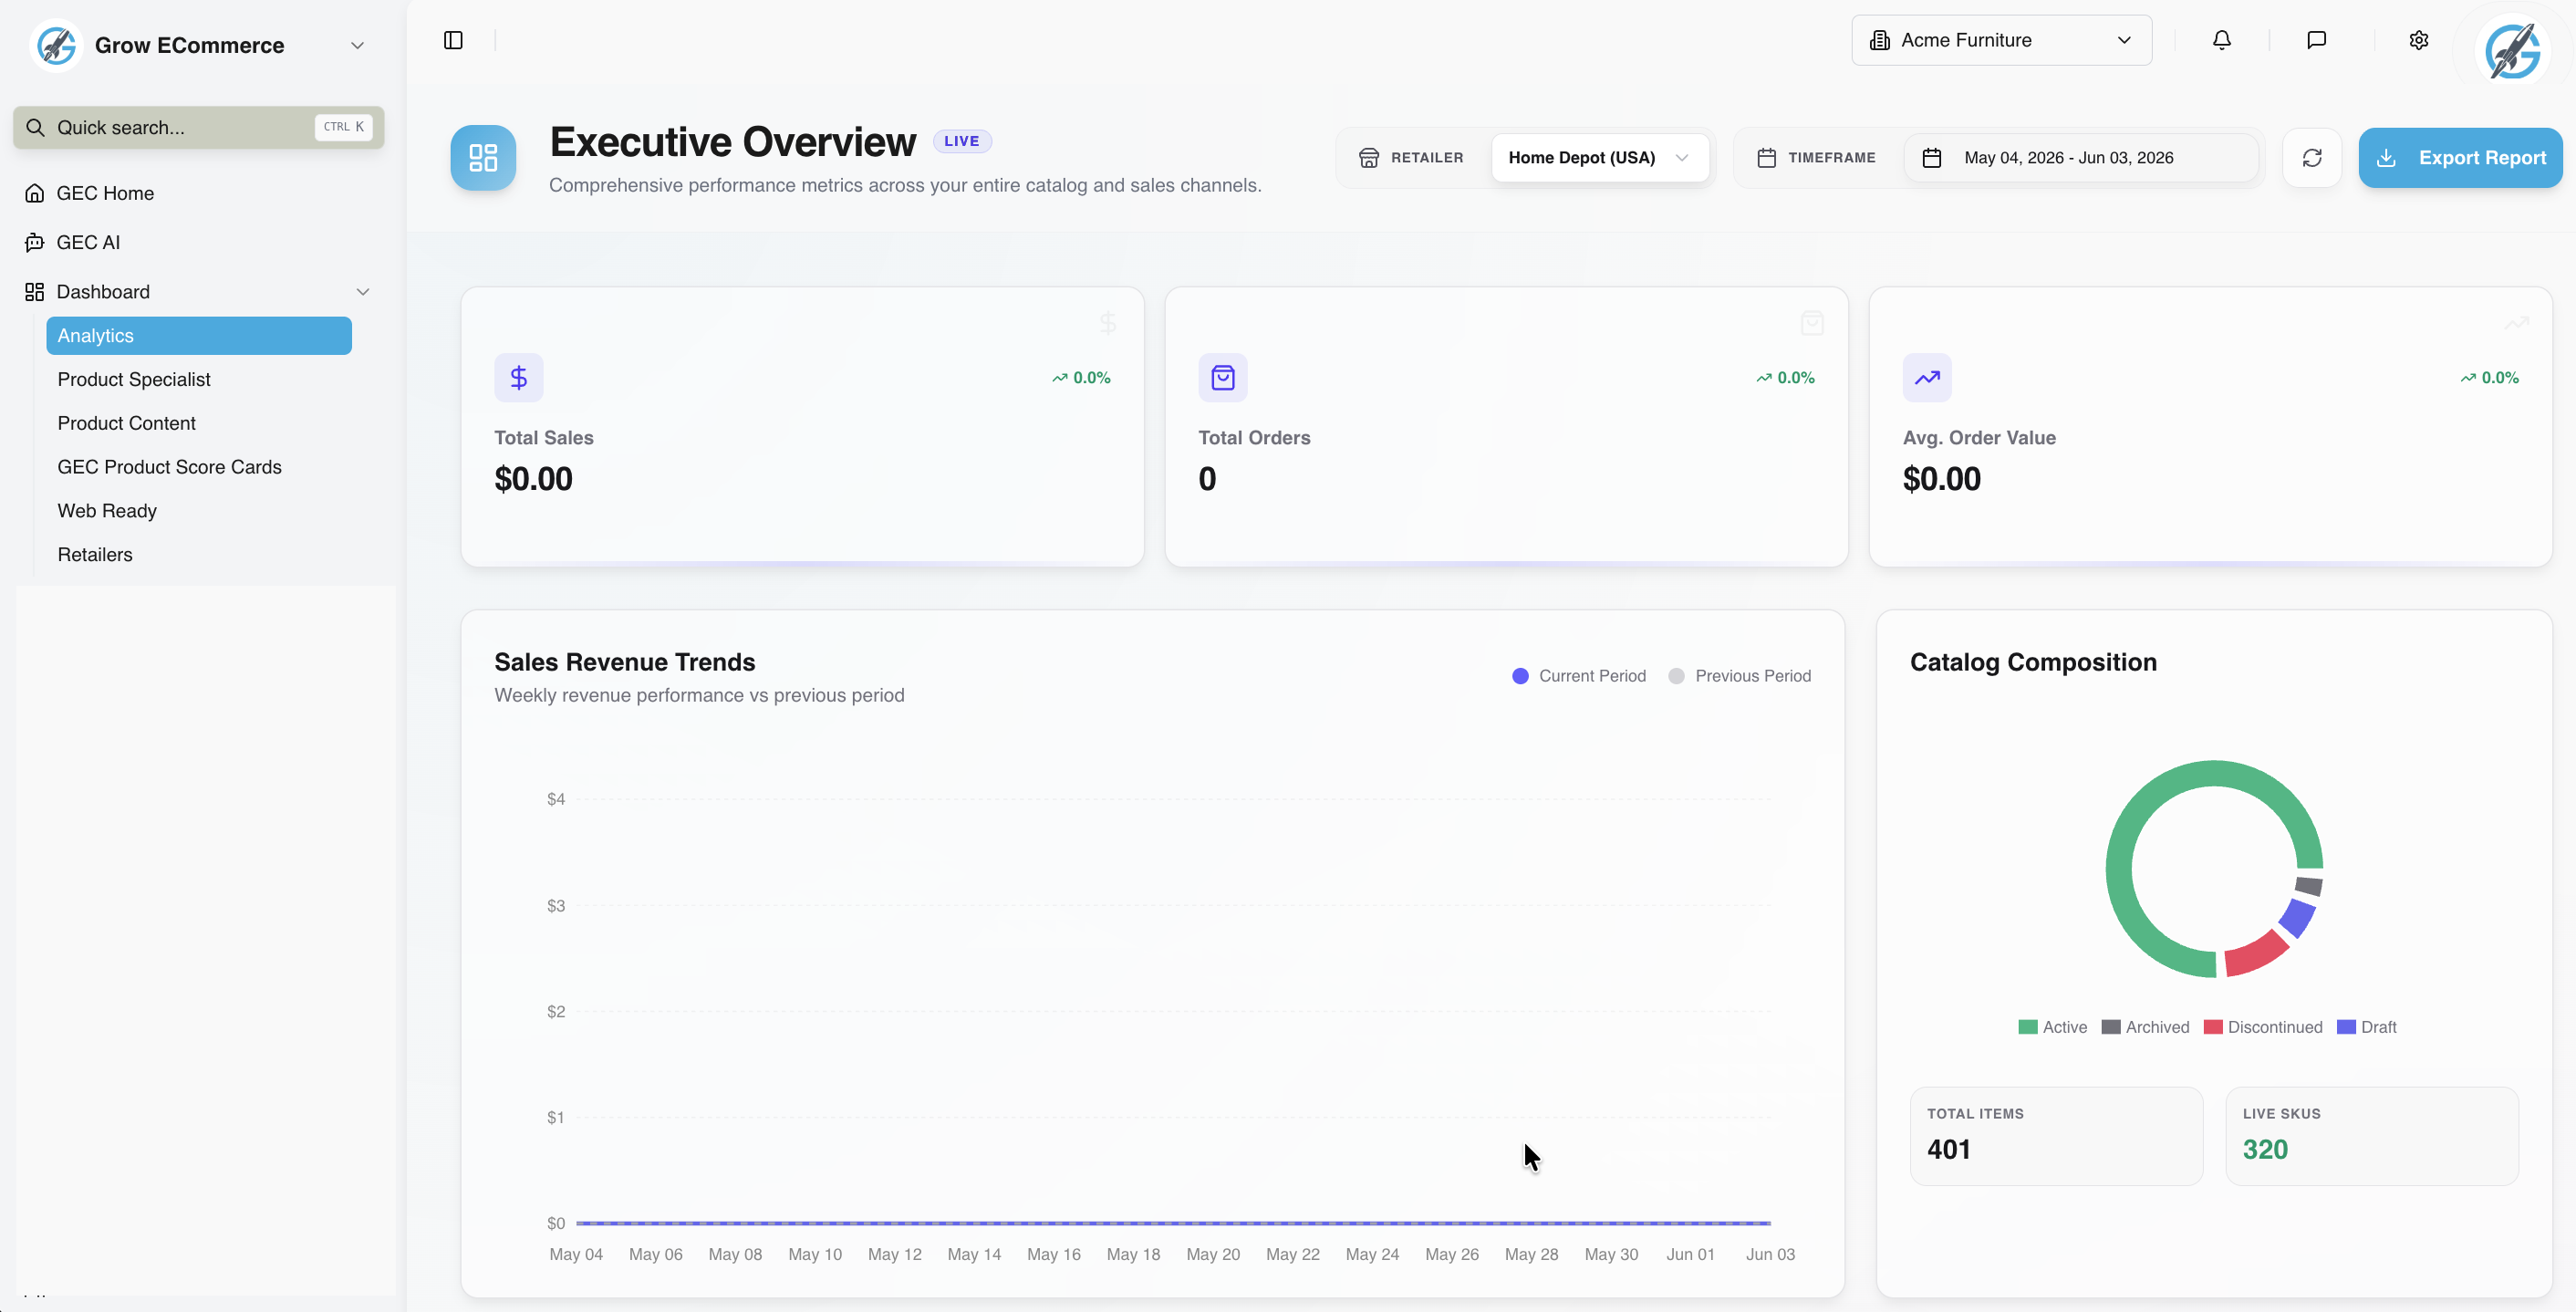
Smart Navigation Sidebar
Navigate effortlessly between report sections — Sales, Charts, Daily, Summary, and PO Log — all organized under collapsible menu groups. The sidebar keeps your workflow focused so you can jump straight to the data you need.
Real-Time KPI Summary Cards
See your most critical metrics at a glance: Total Sales, Total Orders, and Average Order Value — each with period-over-period change indicators. These cards update in real-time so you always know where you stand.
Sales Revenue Trends & Catalog Composition
Compare current vs. previous period revenue performance with interactive line charts. The Catalog Composition donut chart breaks down your product statuses — Active, Archived, Discontinued, and Draft — with Total Items and Live SKUs at a glance.
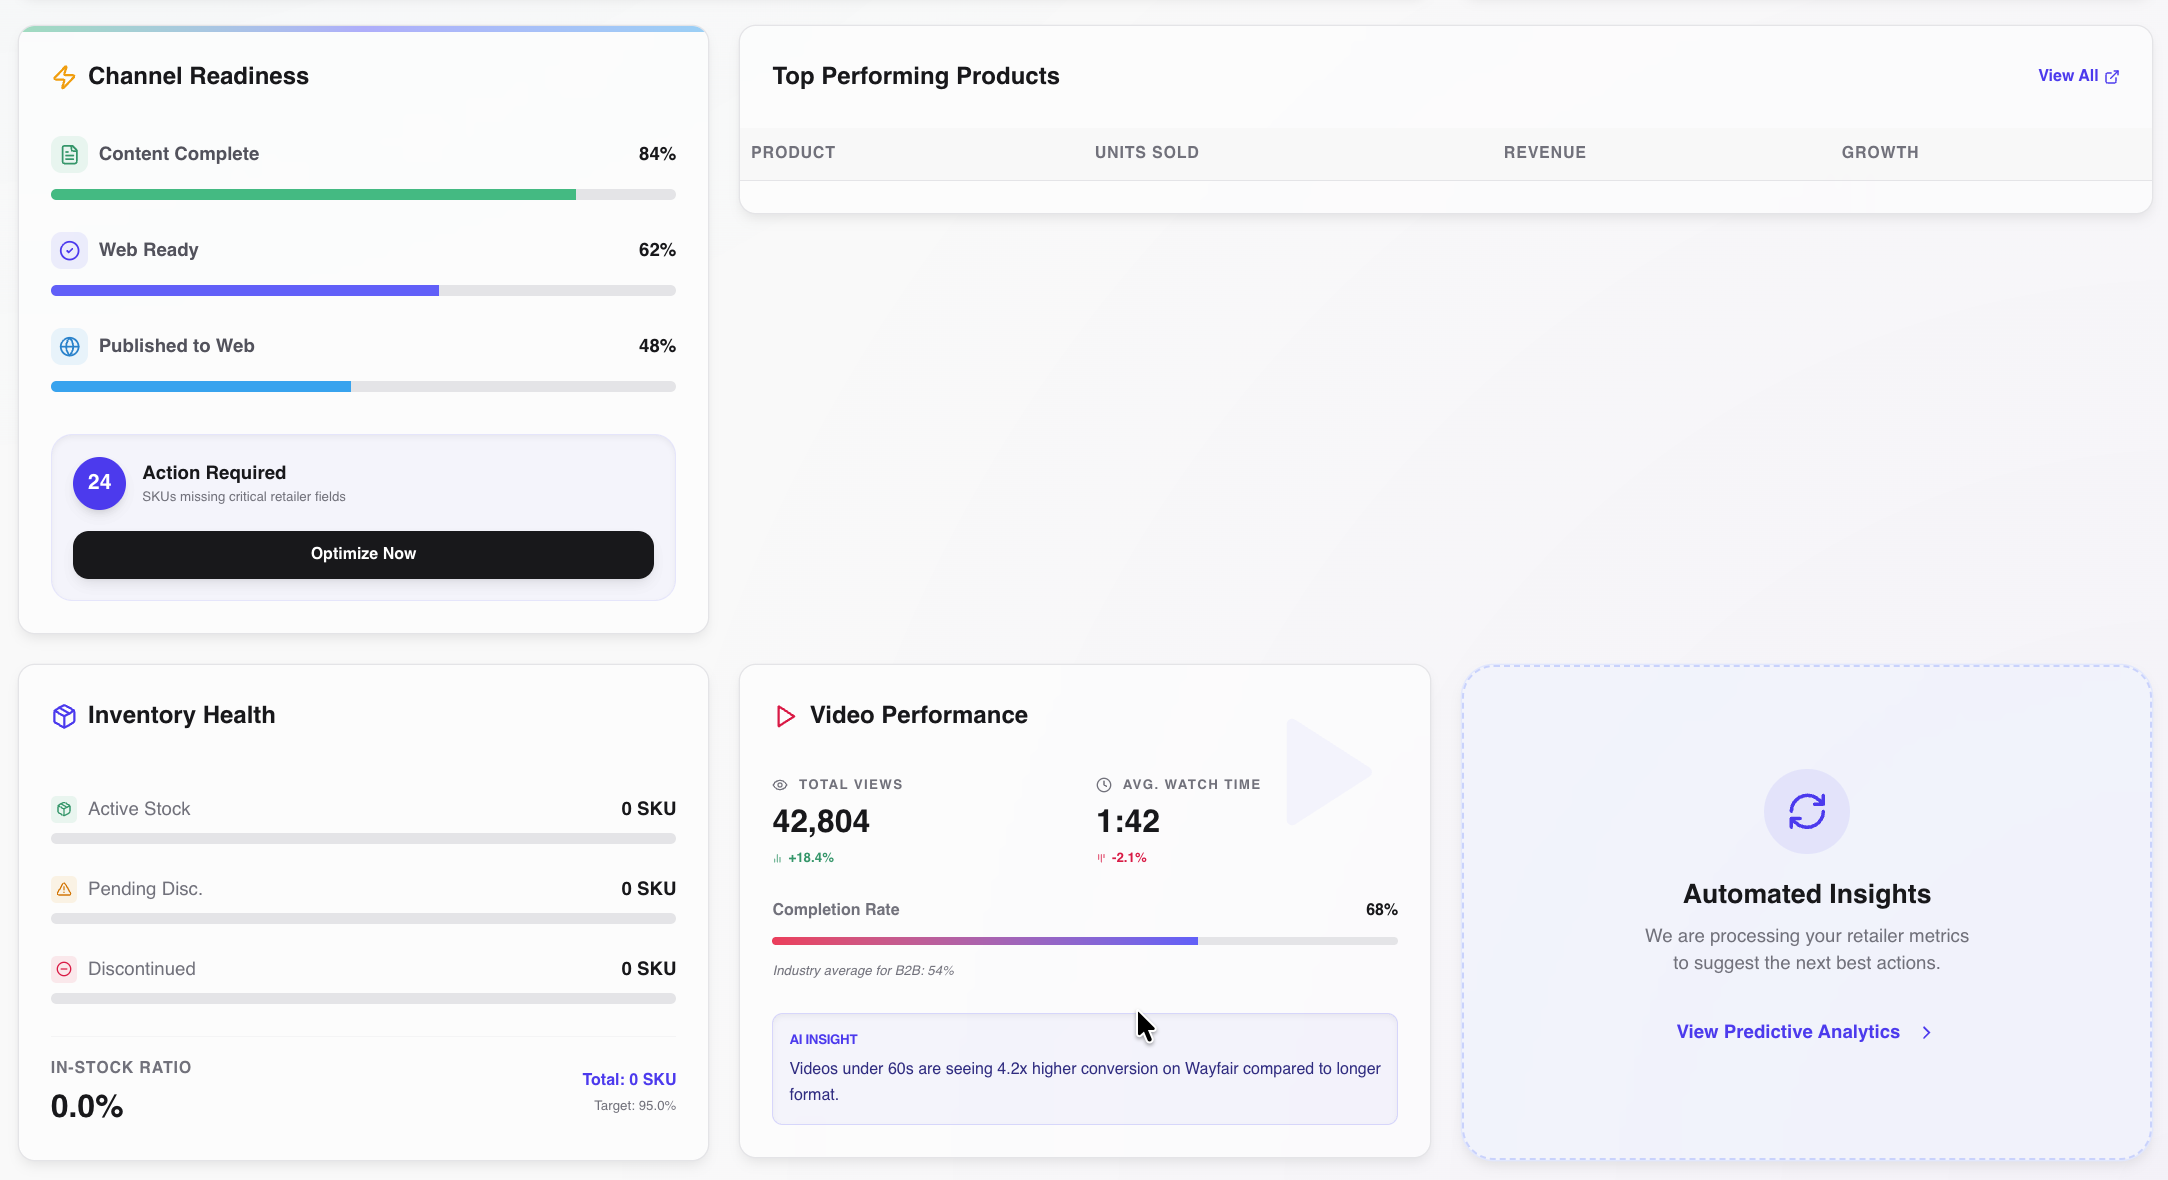
Channel Readiness & Top Products
Track content completeness, web readiness, and published rates with progress bars. Action alerts highlight SKUs missing critical fields. The Top Performing Products table ranks items by units sold, revenue, and growth rate.
Inventory Health, Video Performance & AI Insights
Monitor active stock levels, in-stock ratios, and discontinuation risk. Track video content with Total Views, Avg. Watch Time, and Completion Rate metrics. AI-powered insights automatically surface optimization opportunities and suggest next best actions.
Three Steps to Full Visibility
Getting started with live reporting is fast and simple.
Connect Your Store
Link your e-commerce platform in one click — we support Wayfair, Amazon, Shopify, and more.
We Generate Reports
Our system pulls live data and builds comprehensive dashboards covering sales, inventory, and content readiness.
Get Actionable Insights
AI-powered recommendations surface the highest-impact optimizations for your business, automatically.